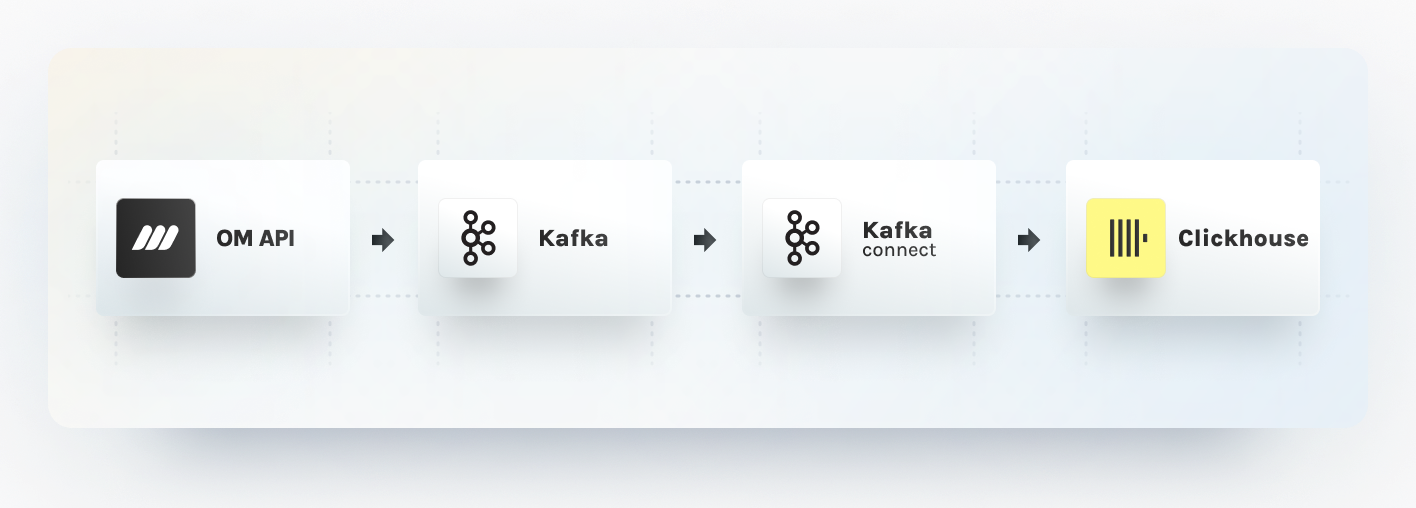
Engineers send millions of events to OpenMeter for ingestion and real-time aggregation of customer usage data. This data fuels essential use cases, including billing, usage gating, and customer dashboards. To achieve scalable metering, OpenMeter employs a multi-step process. It ingests usage events into Kafka and continuously pre-aggregates consumption into coarser one-minute tumbling windows. These aggregates are then stored in a database for future queries.
This article explains why OpenMeter opted for ClickHouse, a column-oriented database, to store and query historical usage data. It also highlights how ClickHouse and ClickHouse Cloud replaced some of our streaming aggregations for small to medium-sized producers.
Event Ingestion
OpenMeter manages scale by ingesting events into Kafka topics first. While events can be optionally pre-aggregated and produced into different Kafka topics, they eventually need to be transferred to ClickHouse. To move data between Kafka and ClickHouse, we rely on Kafka Connect. This framework provides a consistent pipeline for moving large data sets in and out of Kafka. A key advantage of Kafka Connect is its support for various source and sink connector plugins, including databases like ClickHouse, PostgreSQL, and MongoDB. It also excels in breaking a single job into multiple smaller tasks, optimizing parallelism and load distribution.
To ensure consistent data movement, we use the ClickHouse Kafka Connect Sink plugin. This relatively new project, developed by the ClickHouse team, guarantees exactly-once delivery between Kafka topics and ClickHouse tables. This guarantee is critical, as Kafka Connect tasks are only aware of the latest topic offset acknowledged by the consumer. For example consumers can fail to acknowledge a processed offset due to a network error or an exception. The exactly once guarantee prevents the risk of dropping or double inserting usage, leading to incorrect billing. You can delve deeper into the ClickHouse Kafka Connect Sink design on GitHub.
Kafka Connect also handles batching for us in a simple, configurable way. This is important because ClickHouse performs the best when you batch your writes together. An ideal batch size can be as big as 100,000 records per second, depending on your data.
Usage Aggregation
OpenMeter conducts pre-aggregation of usage events into one-minute tumbling windows. These aggregated data points are then stored in a long-term database, enabling real-time metering at scale. Initially, streaming aggregation was achieved using separate ksqlDB stream processing for each meter. However, this approach proved expensive for small to medium-scale producers, as ksqlDB has limitations in terms of the number of persisted queries it can run per instance and its lack of clusterization support.
We explored alternative solutions and settled on ClickHouse's AggregatingMergeTree engine. This engine enables incremental data aggregation when combined with MaterializedView. MaterializedViews are trigger-based and update automatically when new records are inserted into the source table. Consequently, every time Kafka Connect transfers a batch of events to ClickHouse, the corresponding materialized views are updated. Since data is partitioned in ClickHouse based on time, only the most recent files are written to disk at insertion time.
Here is a sample configuration of our materialized views:
CREATE MATERIALIZED VIEW IF NOT EXISTS openmeter.meter_meter1 (
    subject String,
    windowstart DateTime,
    windowend DateTime,
    value AggregateFunction(sum, Float64),
    group1 String,
    group2 String
) ENGINE = AggregatingMergeTree()
ORDER BY
    (windowstart, windowend, subject, group1, group2) AS
SELECT
    subject,
    tumbleStart(time, toIntervalMinute(1)) AS windowstart,
    tumbleEnd(time, toIntervalMinute(1)) AS windowend,
    sumState(cast(JSON_VALUE(data, '$.duration_seconds'), 'Float64')) AS value,
    JSON_VALUE(data, '$.group1') as group1,
    JSON_VALUE(data, '$.group2') as group2
FROM
    openmeter.meter_events
WHERE
    openmeter.meter_events.type = 'myevent'
GROUP BY
    windowstart,
    windowend,
    subject,
    group1,
    group2
It is worth noting that AggregatingMergeTree tables merge eventually, while
MaterializedView on the same engine updates incrementally via insert triggers.
To handle failure scenarios, such as when the view cannot process a record, we
leverage the Dead Letter Queue pattern and send failed records to a separate
Kafka topic for later processing.
In our future efforts to alleviate the write load on ClickHouse, especially for hot Kafka topics, we will explore leveraging scalable stream processing technologies like Arroyo. Arroyo can automatically scale jobs in cluster mode and pre-aggregate usage data into tumbling windows.
Our plan is for OpenMeter to detect high event rate Kafka topics and take autoscaling actions to enable streaming aggregation, ultimately reducing batch sizes before sending data to ClickHouse.
Querying historical usage
Data stored in ClickHouse is efficiently organized on disk, sorted by primary
key columns such as windowstart, windowend, subject, and groupings. For
instance, our materialized view for a meter recording AI usage with one-minute
tumbling windows appears as follows:
| windowstart | windowend | subject | model | value |
|---|---|---|---|---|
| 2023-01-01 00:01:00 | 2023-01-01 00:02:00 | customer-1 | gpt-4 | 119 |
| 2023-01-01 00:01:00 | 2023-01-01 00:02:00 | customer-1 | gpt3-turbo | 34 |
| 2023-01-01 00:01:00 | 2023-01-01 00:02:00 | customer-2 | gpt-4 | 42 |
| 2023-01-01 00:02:00 | 2023-01-01 00:03:00 | customer-1 | gpt-4 | 28 |
| 2023-01-01 00:02:00 | 2023-01-01 00:03:00 | customer-2 | gpt-4 | 72 |
The larger the time range we query, the more records ClickHouse has to read from the disk and aggregate. Given that we store data in one-minute tumbling windows, querying for one hour would involve scanning 60 records, assuming every minute has historical data. Additionally, as we store separate records per subject and groupings, this number multiplies by the permutations of these groupings.
ClickHouse best practices dictate the use of MaterializedViews to optimize queries. If the need arises to scan larger time ranges, such as months or years, we can easily create new views with coarser-grained records to optimize our queries accordingly.
Summary
ClickHouse proves to be a robust database suitable for real-time and analytics use cases. At OpenMeter, we have chosen ClickHouse to store and query historical usage data. We move data from Kafka topics to ClickHouse tables via Kafka Connect. As part of adopting ClickHouse, we also started contributing to the ClickHouse Kafka Connect Sink plugin and looking forward to getting more involved. While the OpenMeter Cloud harnesses the power of the managed ClickHouse Cloud, we also added Helm charts to our open-source distributions to streamline self-service deployments.
In the future, we will implement pre-aggregation streaming processing with Arroyo for hot Kafka topics, reducing the number of writes to ClickHouse and enhancing the efficiency of our metering solutions.