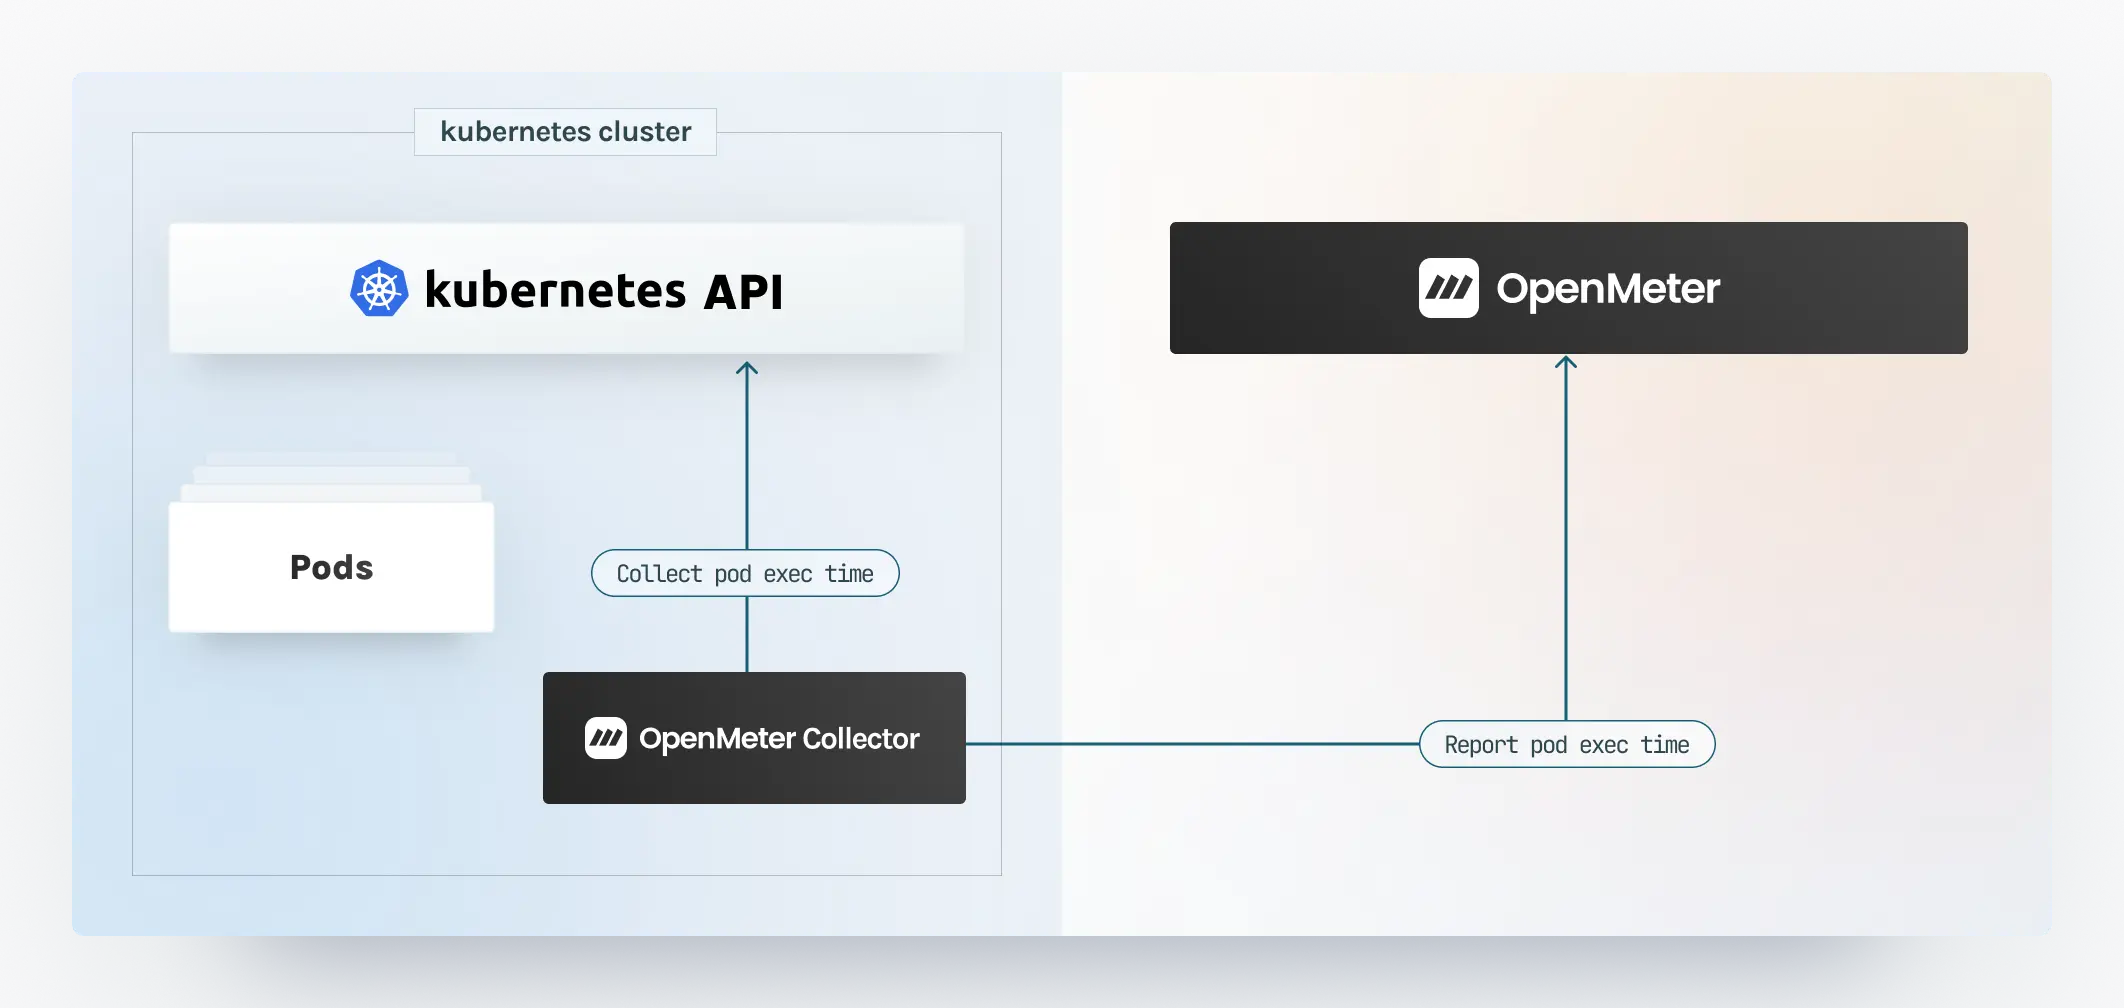
Kubernetes has emerged as the standard for deploying, managing, and scaling containerized applications. Companies running their workloads on Kubernetes want to meter container CPU time to distribute shared spending internally or to pass through workload costs to their customers. To simplify per-second billing and metering, we created an out-of-box Kubernetes collector to measure pod execution time accurately.
Getting Started
The OpenMeter Kubernetes collector is distributed as a Helm chart to facilitate deployment and configuration. Once the collector is up and running, you can fine-tune it to your needs.
First, you need to run an OpenMeter instance. You can sign up for a free trial of OpenMeter Cloud here. Then, all you need to do is to create an API token and pass it to the Helm install command below.
You can then install it in your cluster using the following command:
export OPENMETER_TOKEN=om_...

helm install --wait --create-namespace \
    --namespace openmeter-collector \
    --set preset=kubernetes-pod-exec-time \
    --set openmeter.token=${OPENMETER_TOKEN} \
   openmeter-collector oci://ghcr.io/openmeterio/helm-charts/openmeter-collector
The collector comes with sane defaults to help you get started. By default, it
watches the default namespace in your cluster and reports each pod's execution
time to OpenMeter every 15 seconds.
This allows you to install and try the collector quickly, but it may not fit your production use cases. You may want more frequent reporting intervals or watch different namespaces. Visit our documentation for the full guide to fine-tune those options.
Digging Deeper
Under the hood, the OpenMeter collector uses [Redpanda Connect](https://www.Redpanda Connect.dev) to collect and report information about running pods in your cluster. Redpanda Connect is a robust stream processing tool that handles the challenges of moving data from one place to another. It handles retries and back pressure, so you can be sure your usage data doesn't get lost in transit.
The OpenMeter collector is a custom distribution of Redpanda Connect, extended with a couple of plugins to integrate it with OpenMeter. It also comes with a few default configurations called presets.
A preset is a fancy name for a Redpanda Connect configuration we bundle with our OpenMeter collector. It contains a complete Redpanda Connect configuration for a specific use case (for example, collecting usage data from Kubernetes and reporting it to OpenMeter). Presets can then be further tuned using environment variables.
While we aim to support a wide range of use cases with our presets, it cannot possibly expose all the knobs Redpanda Connect allows you to turn, so it may become necessary to customize these presets by directly editing the configuration file.
You can read more about that in our documentation, but I encourage you also to checkout the Redpanda Connect documentation.
Last but not least, you can find the Kubernetes preset itself here.