Get Started
Get started with the OpenMeter Collector in minutes.
Install the OpenMeter Collector
The OpenMeter Collector is available as a Helm chart with multiple presets.
1. HTTP server with event buffering
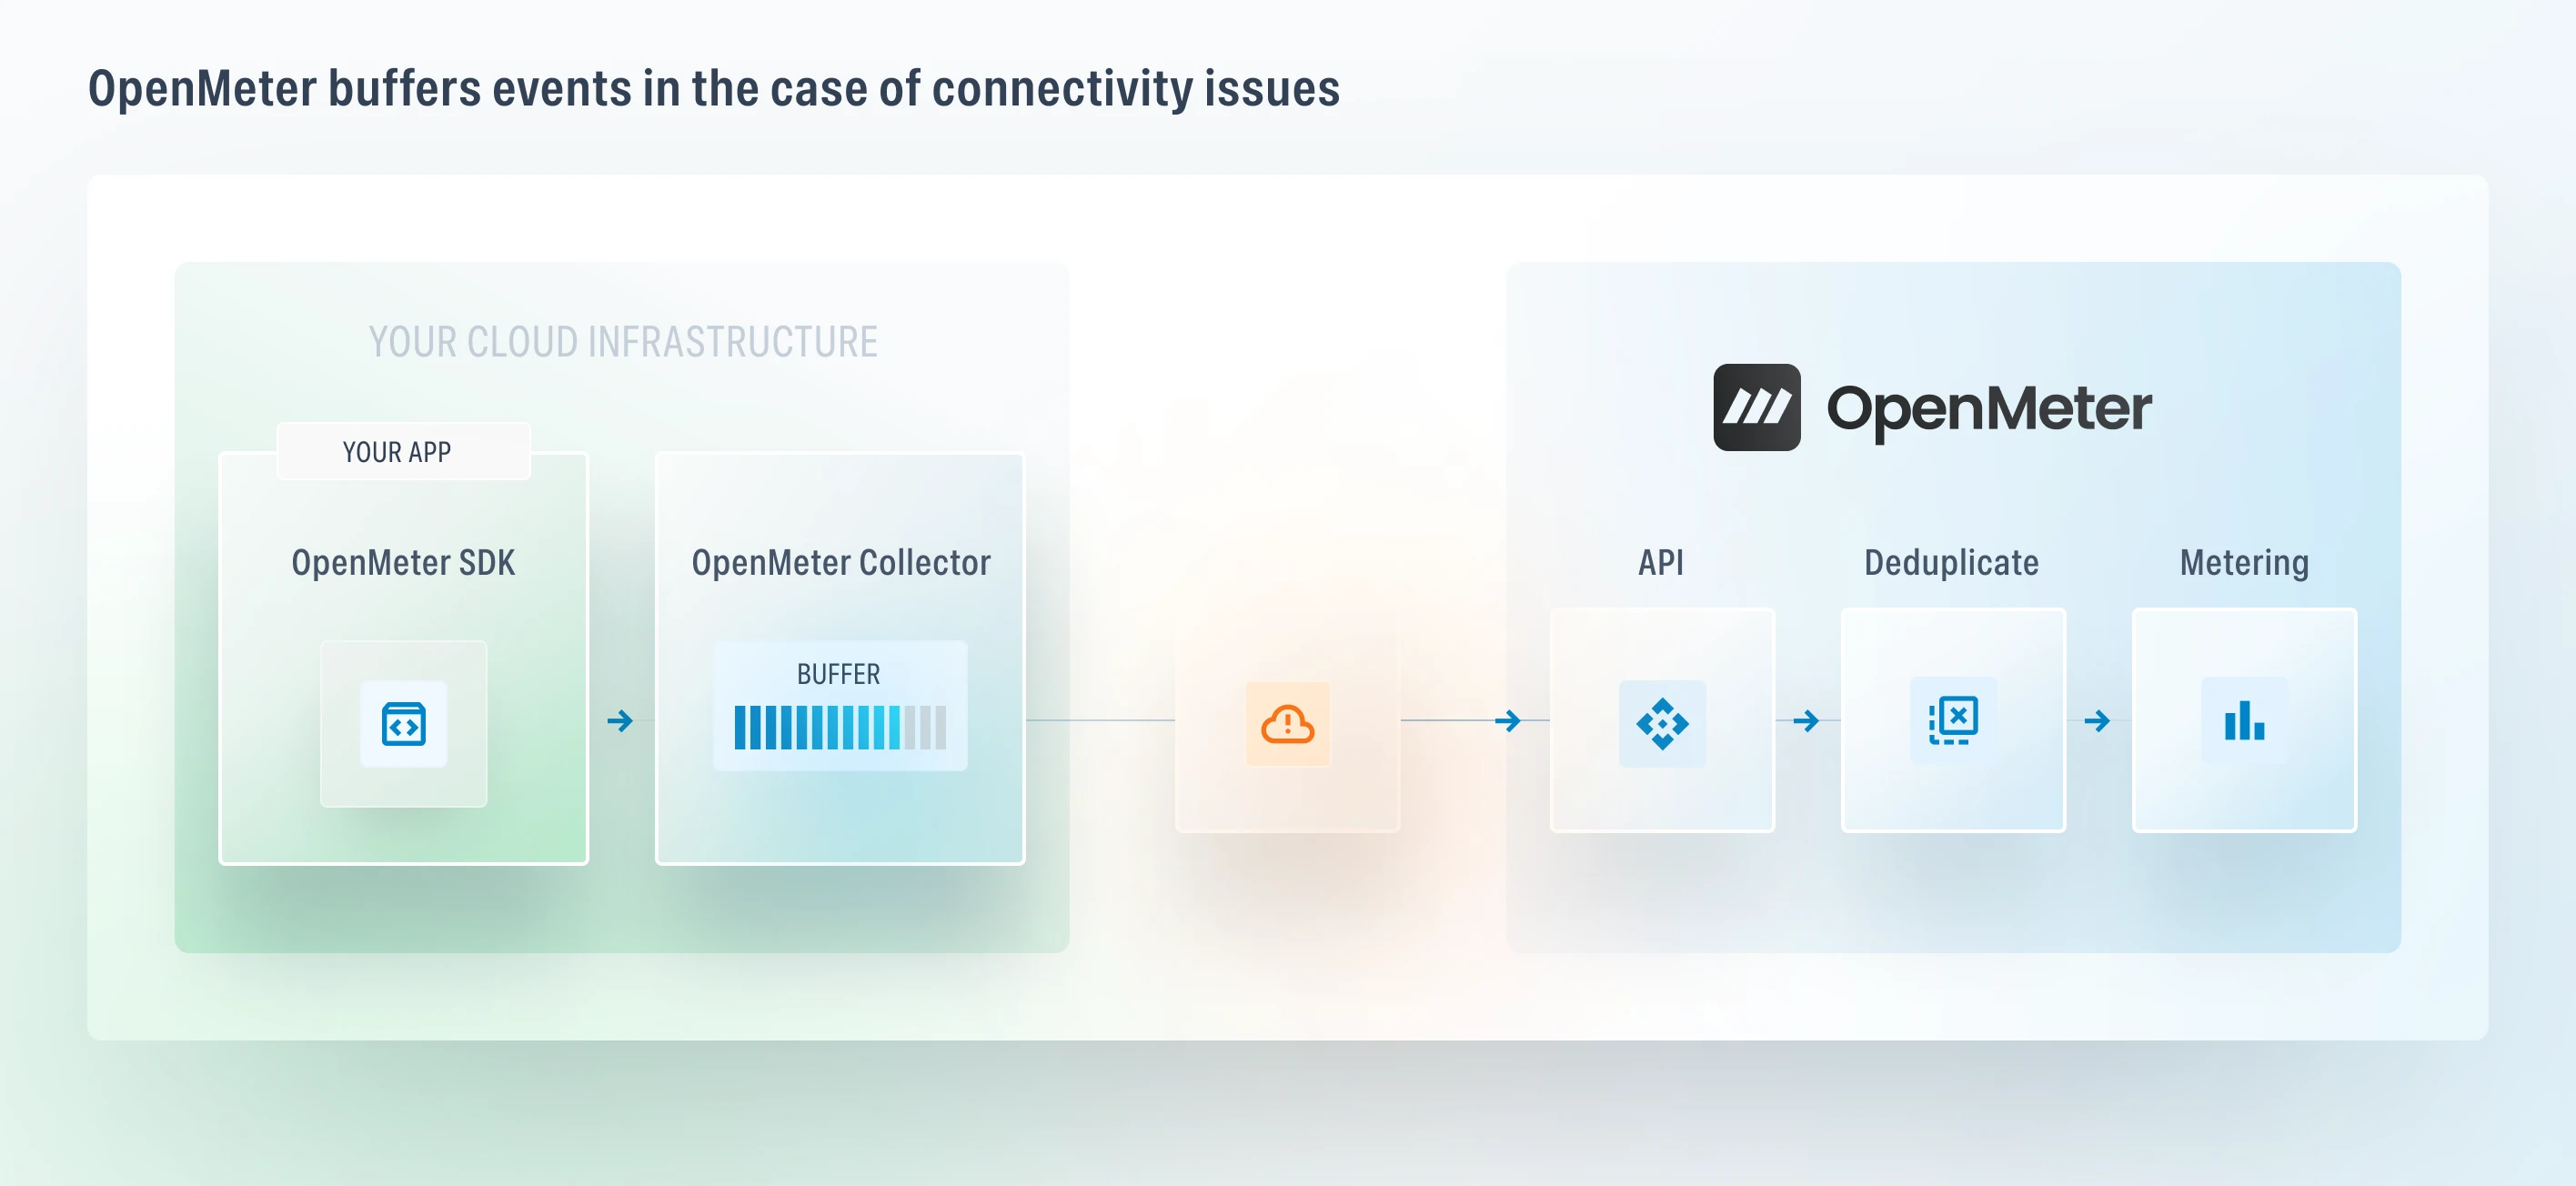
The HTTP Server preset is the simplest preset useful when you want to point your SDKs to the collector. In this case, the collector will listen for events on the HTTP server and send them to the OpenMeter API. This present enables the buffer, to avoid any data loss in case of temporary network issues.
Getting started with the HTTP Server preset:
# Set your OpenMeter token
export OPENMETER_TOKEN=om_...

# Get the latest version or visit https://github.com/openmeterio/openmeter/pkgs/container/helm-charts%2Fbenthos-collector
export LATEST_VERSION=$(curl -s https://api.github.com/repos/openmeterio/openmeter/releases/latest | jq -r '.tag_name' | cut -c 2-)

# Install the collector in the openmeter-collector namespace
helm upgrade openmeter-collector oci://ghcr.io/openmeterio/helm-charts/benthos-collector \
  --version=${LATEST_VERSION} \
  --install --wait --create-namespace \
  --namespace openmeter-collector \
  --set fullnameOverride=openmeter-collector \
  --set openmeter.token=${OPENMETER_TOKEN} \
  --set service.enabled=true \
  --set storage.enabled=true \
--set preset=http-serverAfter the collector is installed, you can point your SDKs to the collector. See event buffering docs.
2. Kubernetes pod exec time
The Kubernetes preset is useful when you want to track runtime of Kubernetes workloads like pods and report them as usage events.
# Set your OpenMeter token
export OPENMETER_TOKEN=om_...

# Get the latest version or visit https://github.com/openmeterio/openmeter/pkgs/container/helm-charts%2Fbenthos-collector
export LATEST_VERSION=$(curl -s https://api.github.com/repos/openmeterio/openmeter/releases/latest | jq -r '.tag_name' | cut -c 2-)

# Install the collector in the openmeter-collector namespace
helm upgrade openmeter-collector oci://ghcr.io/openmeterio/helm-charts/benthos-collector \
  --version=${LATEST_VERSION} \
  --install --wait --create-namespace \
  --namespace openmeter-collector \
  --set fullnameOverride=openmeter-collector \
  --set openmeter.token=${OPENMETER_TOKEN} \
--set preset=kubernetes-pod-exec-timeAdvanced configuration
The OpenMeter Collector can be configured manually if the preset doesn't meet your needs.
Read more about the configuration for Redpanda Connect pipelines.
-
Modify the
configparameter in thevalues.yamlfile:values.yaml # Enable storage to avoid data loss storage: enabled: true # Enable service to expose the collector as a service service: enabled: true # Configure the collector config: logger: level: "${LOG_LEVEL:DEBUG}" format: "${LOG_FORMAT:json}" # Log fields that are constant across all events static_fields: service: "openmeter-collector" instance: "${K8S_APP_INSTANCE:unknown}" version: "${K8S_APP_VERSION:unknown}" # Timeout before shutting down the collector shutdown_timeout: 10s http: enabled: true address: 0.0.0.0:4195 debug_endpoints: false # Define the input sources for collecting metrics input: http_server: address: 0.0.0.0:8080 path: /api/v1/events allowed_verbs: - POST timeout: 10s sync_response: status: '${! meta("http_status_code").or("204") }' headers: Content-Type: '${! meta("content_type").or("application/json") }' processors: # Track metrics on received events - metric: type: counter name: openmeter_event_received value: 1 # Validate that mapped events conform to CloudEvents schema - label: "validation" json_schema: schema_path: file://./cloudevents.spec.json - catch: - log: level: ERROR message: "schema validation failed due to: ${!error()}" fields_mapping: |- root = this # Return a 400 Bad Request response for invalid events - mapping: | meta http_status_code = "400" meta content_type = "application/problem+json" root = { "type": "about:blank", "title": "Bad Request", "status": 400, "detail": "invalid event: %s".format(error()), } - sync_response: {} # Drop messages that fail validation - mapping: root = deleted() # Return a 204 No Content response for valid events - mapping: | meta http_status_code = "204" - sync_response: {} # Persistent buffer to ensure data isn't lost during processing buffer: sqlite: path: "${BUFFER_PATH:./buffer.db}" post_processors: # Split buffered data into smaller batches for processing - label: "buffer_split_batch" split: size: 100 # Send processed events to OpenMeter output: label: "openmeter" drop_on: error: false error_patterns: - Bad Request output: http_client: url: "${OPENMETER_URL:https://openmeter.cloud}/api/v1/events" verb: POST headers: Authorization: "Bearer ${OPENMETER_TOKEN:}" Content-Type: "application/json" timeout: 30s retry_period: 15s retries: 3 max_retry_backoff: 1m # Maximum number of concurrent requests max_in_flight: 64 batch_as_multipart: false drop_on: - 400 # Batch settings for efficient API usage batching: # Send up to 100 events in a single request count: 100 # Or send after 1 second, whichever comes first period: 1s processors: # Track metrics on sent events - metric: type: counter name: openmeter_events_sent value: 1 # Convert batch to JSON array format - archive: format: json_array dump_request_log_level: DEBUG # Expose internal metrics in Prometheus format on /metrics endpoint metrics: prometheus: add_process_metrics: true -
Install the collector with Helm using the
values.yamlfile:# Set your OpenMeter token export OPENMETER_TOKEN=om_... # Get the latest version or visit https://github.com/openmeterio/openmeter/pkgs/container/helm-charts%2Fbenthos-collector export LATEST_VERSION=$(curl -s https://api.github.com/repos/openmeterio/openmeter/releases/latest | jq -r '.tag_name' | cut -c 2-) # Install the collector in the openmeter-collector namespace helm upgrade openmeter-collector oci://ghcr.io/openmeterio/helm-charts/benthos-collector \ --version=${LATEST_VERSION} \ --install --wait --create-namespace \ --namespace openmeter-collector \ --set fullnameOverride=openmeter-collector \ --set openmeter.token=${OPENMETER_TOKEN} \ -f ./values.yaml
Last updated on